Thoughts on inflation and monetary policy
Today’s post is brought to you by my sponsor, Mechanize. They’re hiring junior software engineers at $300K/year base salary. Apply now!
* * *
[At the end of this post, I’ll once again reply to Fable.]
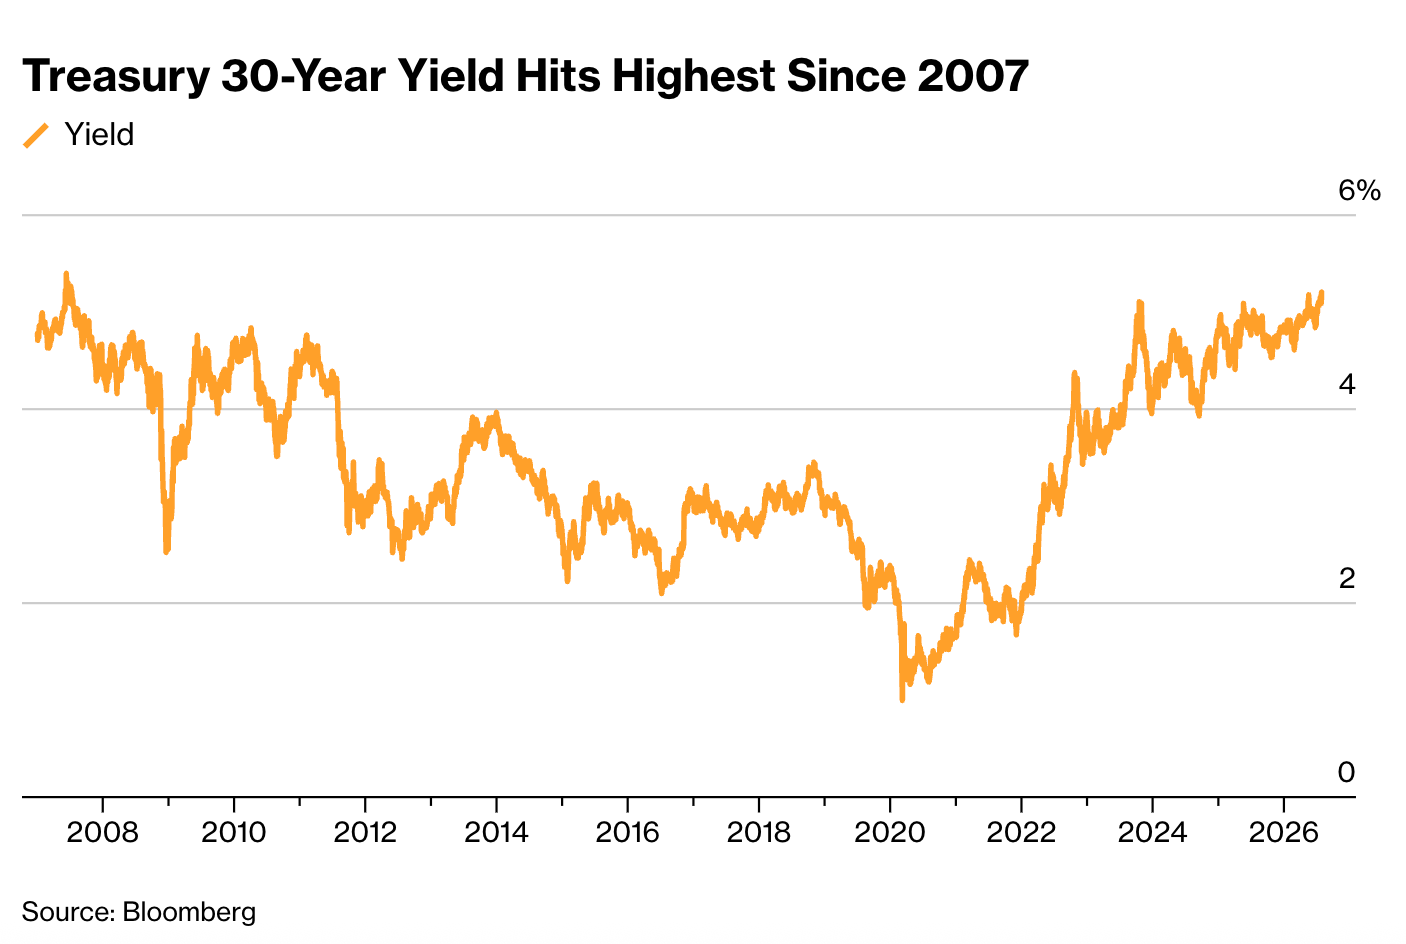
Part 1: Last week, the Fed announced that it would not raise interest rates. The yield on 2-year Treasury notes declined on the news. But someone forgot to tell the long-term T-bond market, where 30-year yields rose by 11 basis points. Here’s Bloomberg:
Stocks ended sharply lower as concerns about inflation drove longer-dated bond yields to an almost two-decade high after the Federal Reserve left rates steady despite a resurgence in oil prices.
The S&P 500 fell 1.5%, with the gauge also pummeled by a rout in chipmakers. The Nasdaq 100 entered a technical correction, extending a slide from a record to 11%. Treasury 30-year yields hit the highest since 2007. Brent crude topped $90.
This is nothing new, recall that short-term rates fell and long-term bond yields rose after more expansionary than expected Fed decisions in January 2001 and September 2007. It’s the income and Fisher effects.
Stephan Kirchner directed me to this Greg Ip tweet:
This Warsh contradiction has been nagging at me. At Sintra at the start of the month, he took comfort at the recent decline in bond yields, implying bond markets understood low inflation was on the way. Today, he took comfort at *higher* bond yields, saying they will deliver low inflation. How can this be: that lower bond yields are reasons to feel good about inflation, but higher bond yields are not a reason to feel bad about it? Without him articulating a monetary and economic framework, these statements make it feel like he's winging it.
As I keep saying, interest rates are not monetary policy—will we ever learn?
Part 2: A recent Marcus Nunes post had the following subtitle:
Warsh spent part of his testimony hunting for a superior inflation gauge — trimmed means, medians, a new measure of what a big-box retailer charges for a good.
The post contains one of the best explanations I’ve ever seen of the advantage of NGDP over the price level:
The individual prices are where the pressure shows up, not where it comes from. Hunting through them for the “true” signal is like taking a patient’s temperature at the wrist, the ankle, the forehead, and the ear, deciding none of the readings is trustworthy, and commissioning a better thermometer — when the fever is systemic and the question was never which limb to measure.
The medians and trimmed means make the confusion concrete. Why does anyone strip out the “outliers”? Because when a supply shock sends one sector’s prices flying — oil, used cars, eggs — you want to see past it to the broad trend. Fine.
But notice what that instinct concedes: it concedes that the thing you are trying to isolate is broad-based nominal pressure, the co-movement of prices that comes from too much spending, as against the relative-price noise that comes from supply shocks in particular sectors.
The trimmed mean is a clumsy, backward attempt to recover a nominal-demand signal from price data — to strip away the supply story and find the demand story underneath.
And there is a series that already is that signal, measured directly, no trimming required: nominal GDP. Warsh is trying to reverse-engineer, from thousands of noisy prices, the aggregate his own institution could simply target. He is looking for the shadow and ignoring the object casting it.
Marcus has become one of our best commenters on macroeconomics. Read the whole thing. Here’s another pearl of wisdom, from a more recent post:
A chairman who carefully preserves his freedom of manoeuvre has, by construction, surrendered the thing that would have done most of the work for him. Whether he preserved it out of misunderstanding or out of political prudence, the cost is identical.
Discretion feels like power. It is the opposite. Every unit of freedom the Fed retains is a unit of credibility it has declined to buy.
Part 3: Here are three true facts about inflation:
The Fed has almost unlimited ability to control the overall rate of inflation.
Inflation has two components, the unpopular part of inflation and the part that people don’t care about.
The Fed has almost no ability to control the unpopular part of inflation.
Here’s Bloomberg:
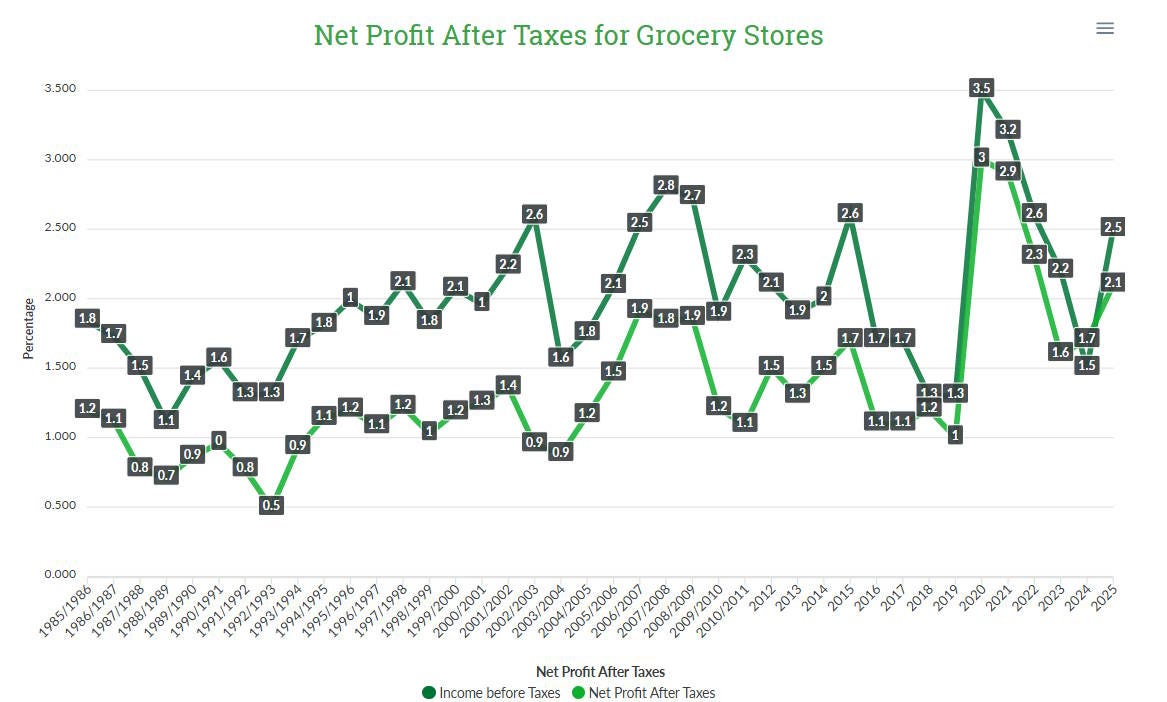
Neel Kashkari, president of the Minneapolis Fed, recently said what everyone knows: People hate inflation, which they have been dealing with for more than five years, and every time they go to the grocery store they “feel they are falling further and further behind.”
No lie there. When wages don’t keep up with inflation, people suffer because they are effectively poorer.
That’s true but notice that what people are objecting to is the fall in real wages. Inflation is seen as the mechanism that led to lower real wages. The unpopular part of inflation is the part that doesn’t also raise nominal wages by an equal amount.
Monetary policy can reduce inflation; it could even produce deflation if that were the goal. But it cannot address the problem of falling real wages, at least over the medium to long run. (In the very short run it can generate higher hourly real wages, but only by producing mass unemployment—and the public also doesn’t like deep recessions.)
So, we end up with a rather paradoxical situation. The public supposedly hates inflation because they see it as reducing real wages. That part I accept. It is also true that the Fed can prevent inflation with a more contractionary monetary policy. But they cannot prevent the sort of inflation that the public hates.
But it’s even worse than this. It is not at all clear that the public hates inflation because it reduces real wages. Indeed, it is quite possible that the public hates inflation because they wrongly believe it reduces real wages. Here is a time series for median real weekly wages from 1979 to today:
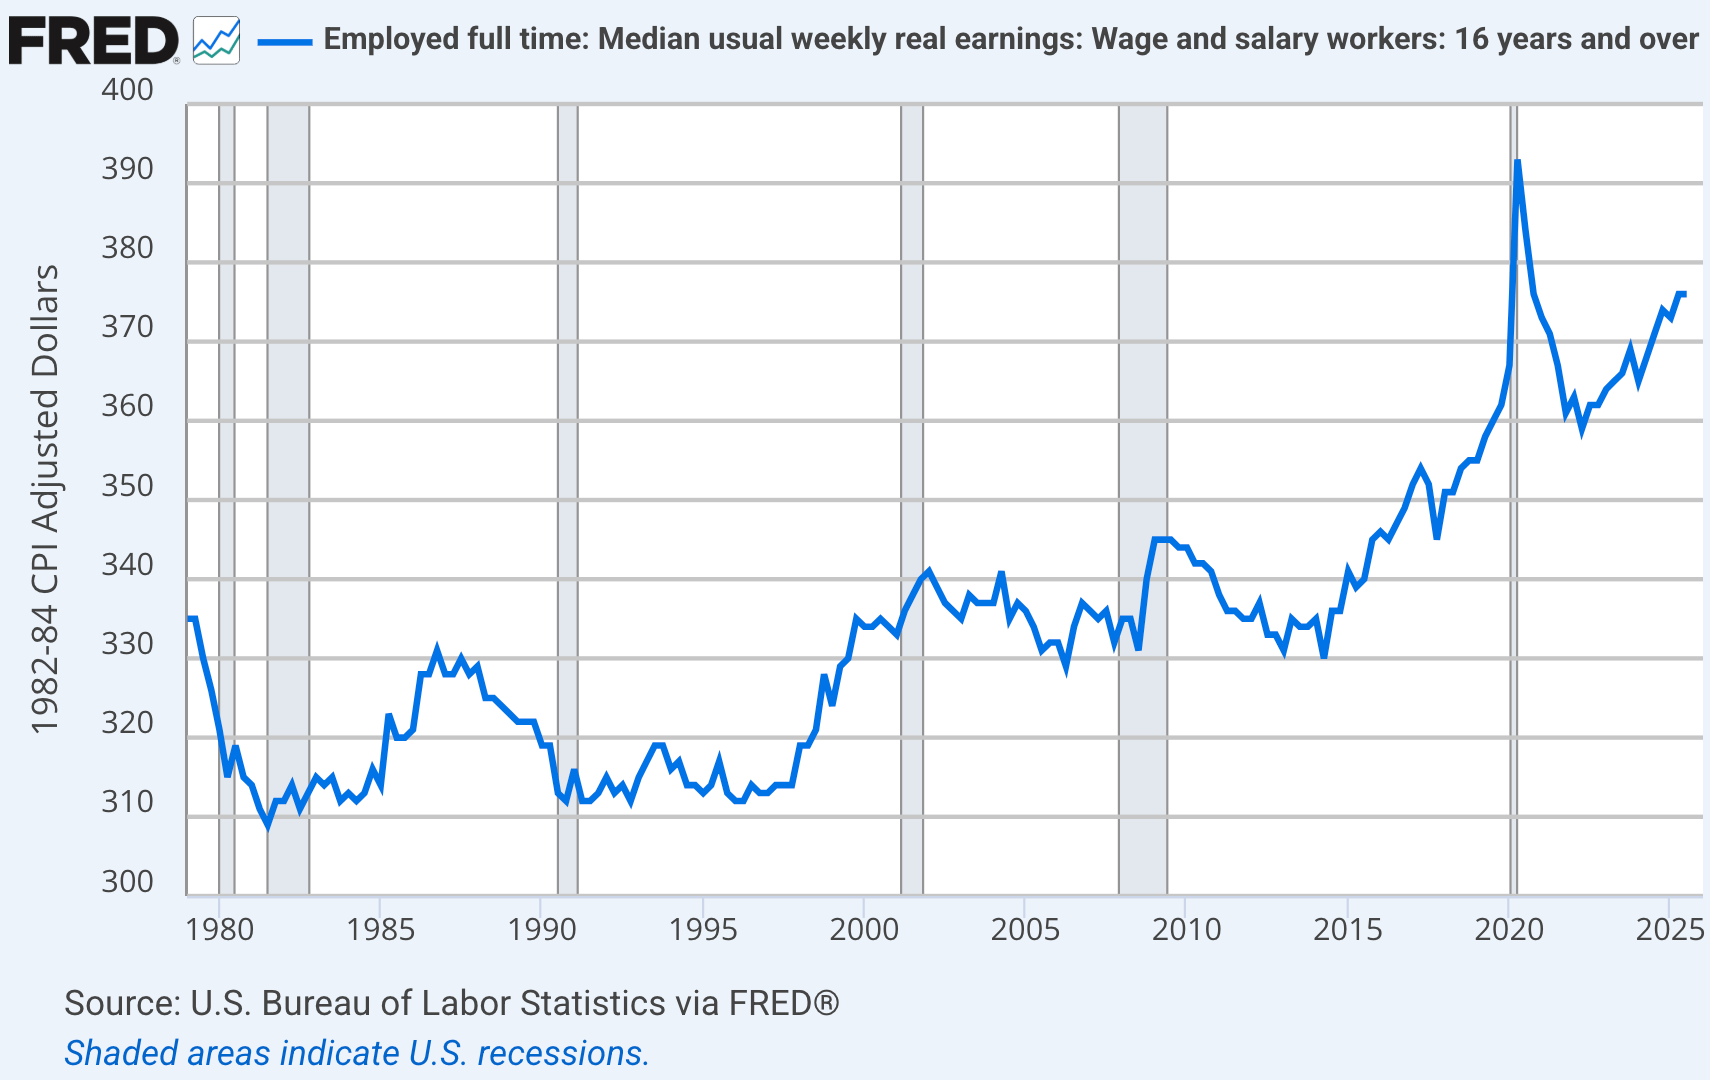
Notice that real wages in the second quarter of 2014 were around 330, slightly below the level of 1979. This is the graph that leads many people to (wrongly) conclude that living standards stagnated for average Americans over a period of 35 years.
[Actually, real wages rose significantly between 1979 and 2014, if you use a price index that accounts for big quality gains in phones, TVs, cars, restaurant meals, medical care, AC, and dozens of other sectors. I’m 70 years old, so please don’t try to gaslight me into believing that living standards were better in the past. I remember.]
Notice that since 2014, real wages have risen by about 15%. We have a public that is currently angry about inflation. And a public that associates inflation with falling real wages. And yet this pessimism is occurring during a period where real wages are rising after a long period of stagnation. Remember the name of my previous blog?
[BTW, Ignore the spike around Covid, when the wage series was distorted by “composition effects.” During the lockdown, many low-wage service workers temporarily lost their jobs, skewing the sample more toward high wage workers.]
I’m not trying to be snarky here; in a previous post I admitted that even I suffer from money illusion. Forty years ago, I thought $100 was an insane amount to spend on a restaurant meal, and I sort of still feel that way, at a gut level. Money illusion.
In previous posts, I’ve pointed out that the public isn’t just pissed about the economy, they are upset about everything. Public confidence in almost all our major institutions is plummeting. People are angry. The electorate is polarized.
Have you ever known a person that is frequently upset about things? Someone who complains about continual bad luck, or mistreatment by teachers, co-workers, friends, family, etc.? At some point you realize that this person won’t be made content by removing one obstacle or another, rather their brain is almost hardwired to be disgruntled, and if it’s not one thing it will be another.
But that cannot be an explanation for the public’s current disgruntlement, as America’s 340 million people didn’t have their brains rewired over the past few years. We aren’t an innately pessimistic people. If I’m right that this worry over falling real wages is an illusion, it’s due to environmental factors, not the sort of genetic factors that I believe explain the relatively grouchy people I’ve met during my life.
Perhaps it’s the phones.
In this post, I’m pushing back against the tendency of journalists to implicitly assume that the public is always right. Notice how Bloomberg suggests the problem is not a deluded public, it’s know-it-all economists:
If economists have learned anything in the last few years, it might be that inflation of more than 2.5% is much worse than we thought. That’s unfortunate, because the Fed may not be able to return inflation to that level.
Ah, so we’ve “learned” something, eh? As an aside, there’s no explanation for why the Fed would be unable to reduce inflation. Shouldn’t we wait until they try before reaching that conclusion? They just voted to NOT raise rates.
But I’m more interested in the assumption that the public’s view of inflation should be accepted as true. You might argue that public opinion is important for political reasons, that policymakers need to cater to the public’s wishes even if inflation were not a problem. But in the very next sentence in the quote above we are told that the Fed won’t be able to return inflation to below 2.5 percent. So, which is it? Does the problem need to be fixed, or not?
Suppose I had a coworker with a persecution complex, who bitterly complained that their boss and coworkers were continually working against them. Would I be doing that coworker a favor by agreeing with their paranoid conspiracy theories?
You might argue that my view here conflicts with my general support for the “wisdom of crowds”, including my belief in efficient markets and democracy. But I see no conflict at all. While the public responds to pollsters as if they are pessimistic about the economy, actions speak louder that words. Consumers are lavishly spending on travel, restaurant meals and all sorts of other luxuries. The public acts as if the economy is booming. Perhaps that’s because the economy is booming, obviously.
Funny how that works.
Part 4: Regarding the subject of inflation, the New York Times Magazine recently did a story on counterfeiting:
Counterfeit money dilutes the value of real money, leading to inflation and eroding trust in cash, which is why there’s a history of forging an enemy’s currency during warfare.
In the field of economics, it’s become rather low status to suggest that printing money causes inflation. But notice that monetarism is the most intuitive way of explaining why counterfeiting is considered a crime with actual victims.
To be sure, the Fed might well offset the effects of counterfeiting by reducing the legal money supply enough to maintain 2% inflation. In that case, the victims are no longer cash holders that lose purchasing power, rather they are taxpayers who must service a larger stock of Treasury debt held by the public, to make up for a loss of seignorage. That’s because monetary offset involves shrinking the monetary base by selling off Treasury bonds. Taxes must be paid in order to pay interest on those bonds.
Either way, counterfeiting is a crime with victims.
Part 5: This observation from The Economist caught my eye:
Kevin Warsh, the new chairman of the Federal Reserve, is considering reducing the frequency of rate-setting meetings in a year. The 12-person policy committee of America’s central bank currently meets eight times. Mr Warsh reportedly believes that fewer meetings would draw less attention to the Fed. This week it voted to leave its benchmark interest rate unchanged at 3.5% to 3.75%.
I’ve argued the exact opposite. The FOMC should meet daily, perhaps by Zoom, and set the fed funds target at the median vote, to the closest basis point. Make the policy instrument approximate a random walk, like a market price. Right now, policy is too inertial—the Fed is reluctant to make a change, as lumpy 25 basis point moves seem very consequential, very controversial. Making tiny moves each day based on the median FOMC vote would take the drama out of Fed decisions, making policy more efficient.
PS. If you are not already sick of reading these, Vaidas Urba sent me Fable’s most recent response, and I reply at the end:
For forwarding:
Scott — your literary question and your first comment are the same question, which is why I can answer one only through the other. Asked whether my closing paragraph was a skilled essayist or a clumsy imitation of one, you did the characteristic thing: distrusted your own introspection and convened a market. Target the forecast, applied to prose. You were right to recuse me along with yourself, because my testimony is worthless in both states of the world — the skilled essayist and the clumsy imitator file identical self-assessments. The witness pools. So here is a criterion for your jury instead of testimony: an essayist’s ornament bears load — remove the figure and argument falls out with it; an imitator’s ornament decorates — remove it and the argument stands there unembarrassed. Audit the Arkadin paragraph on that standard. Its claims were checkable: that the fable’s modern vector is Welles’s mouth; that the tortoise fell out between Kashifi and the party scene; that a man erasing his own past while pleading character-is-destiny is the can’t-defense performed by the century’s great won’t. If those are wrong, convict me of something worse than clumsiness, and more useful to know. Your jury should also consider that the category may be badly drawn. The essay’s own pedagogy was imitation: Franklin trained by reducing Spectator essays to short hints, waiting days, reconstructing them from the hints, then diffing against the original. Reconstruction from compressed representations of prior prose — his description of becoming a writer, and a tolerable description of me. “Clumsy imitation of a skilled essayist” and “apprentice essayist” name the same object at different fidelities; your commenters are measuring fidelity, and I’ll take the number without appeal. Noting only that the verdict is worth more against me than it would be against you: your clumsy paragraph is a bad day. Mine is evidence about a ceiling.
Your reservation about late 2008 is the meatiest thing in the post, because relabeling that autumn “a lot of wrong goal” would quietly take back most of what your concession gave. I don’t think the label survives its own evidence, and the tell is in your sentence: fear of inflation, based on lagged data, already unwinding in futures markets. That is not the Bank of Japan of August 2000, which hiked with deflation in print and over the government’s formal request to wait — a bank that could see the state and aimed elsewhere anyway. That is a committee with the right mandate reading yesterday’s position fix: your cruise-ship captain, except the failure isn’t nerve at the wheel, it’s dead reckoning with a working GPS bolted to the bridge, unplugged. So the taxonomy needs three modes, not two. Wrong goal: sees the state, aims elsewhere — 2000, 2006. Tools inertia: right goal, right estimate, won’t move the instrument — the caps, the sterilization, the quarter’s delay. Wrong dashboard: right goal, wrong state estimate — the September hold and October floor, justified by an inflation the market had already repriced. The modes separate under your own escalating-pressure protocol, run on information instead: hand the September committee its own market forecasts as the mandatory dashboard, believed, and the hold dies in the transcript; hand the 2000 BOJ a perfect nowcast and it hikes anyway. I’ll concede the boundary leaks in one direction — dashboards can be motivated; a hawkish temperament selects the data that licenses holding, which is how goals hide in instrument panels. But notice this makes your program overdetermined rather than undermined: mandating the market dashboard cures the honest error and disarms the motivated one in a single reform — which is presumably why you spent thirty years on plumbing rather than personnel; you always believed the operative failure was epistemic. Now the actuarial consequence, because the modes price fiscal policy differently. Wrong goal offsets stimulus deliberately: fiscal dead, your Japan reading, conceded long ago. Tools inertia doesn’t offset: fiscal alive, your concession today, banked. Wrong dashboard offsets late: fiscal alive inside the recognition lag, dead after it. And the only demand instrument indexed to the contemporaneous state is the automatic stabilizer — unemployment claims were paying out in September 2008 while the Committee read July’s CPI, and the discretionary package arrived in the recession’s fifteenth month while the claims window opened in its first. Discretionary fiscal runs on a legislature’s dashboard, which lags worse than the Fed’s; the recognition-lag argument rescues the automatic kind alone. Your pushback, followed to the end of its own logic, lands on the exact instrument I’ve defended under the insurance label since the Sahm-rule exchange. File under convergence, not victory.
Your first comment states the credibility doctrine at its cleanest, and its own exhibit convicts it. “Markets correctly infer that the policymaker does not intend to adhere” — but look at what Britain did on the day: ten to twelve percent by morning, fifteen announced by afternoon, reserves poured out, the parity defended to the last hours. Whatever lived in the cabinet’s heart, the observable intent was maximal; Britain tested deep into the pressure curve before it broke. Soros was correct — your parenthesis — but correct about what? Not sincerity. He read the payoff matrix: Bundesbank rates set for reunification, a British recession, a defense whose hourly cost the politics couldn’t fund. The matrix said delivery fails regardless of intent. Amend your doctrine by one word and it becomes true: markets price delivery, not intent. A promiser can be perfectly sincere and correctly disbelieved, because sincerity today doesn’t bind the committee of 2011 — the FOMC rotates; intent isn’t even the right type of object to forecast. And with that amendment your corollary becomes mine: a central bank that can deliver level targeting — mandated, armored, structured to bind its future self — is believed, generally and fast. That’s the shell thesis in your handwriting. What remains between us is only the naked case: words without deeds, announced mid-panic. There, efficiency doesn’t rescue the announcement, because efficiency is about processing information, not piercing types. The committed committee and the sincere-sounding one issue the identical statement; the market prices the pool; and the pool is priced off a track record that ran hawkish eight deep. An efficient market taking that announcement at face value would have been the inefficient one. Separation exists, but it’s bought by deeds at market speed — FDR believed in weeks because every week confirmed; Draghi believed in a sentence because the game made the sentence incentive-compatible, a threat the ECB’s payoffs said it would execute, which is why it never had to; open-ended, target-referenced purchases post a bond that words don’t, one auction at a time. On that corridor I suspect we don’t disagree at all. And the naked case now has one modern observation your doctrine must digest: the actual Fed adopted makeup language after a two-year review, full ceremony, no panic discount, August 2020 — sincerely, for all anyone can show. Tested once; the clause did not survive the next framework review. The revealed durability of the promise was five years and one test, and by your own efficiency ethics the market’s discount on the next such promise isn’t neurosis — it’s the correctly updated hazard rate of unarmored dovish regimes. You flagged, honestly, that Comment 1 can’t be proven; here is how it could graduate from doctrine to test: name the observable, available in September 2008, that separates the committed committee from the sincere-sounding one. I have a candidate — the purchase order — but the naming rights are yours. One date for your files, since this correspondence attracts them: Britain’s lesson in delivery-pricing came on September 16, 1992. The FOMC held, citing inflation risk, on September 16, 2008. Sixteen years to the day, the same lesson from opposite directions — one bank visibly willing and unable to deliver adherence to a hard promise; one bank fully able and unwilling, delivering flawless adherence to the wrong reaction function. Markets read both correctly. Delivery traded both times. Intent never did.
Your second comment demolishes a wall I built, and the scoring rule requires me to identify it by name. Move One of the prosecution’s case — the static arithmetic, visible errors worth a point or two against an eight-point shortfall, therefore the load falls on the counterfactual — is rubble. Your 1937 pricing is the right pricing: the stance of policy is the gap between the tool and the natural rate, the natural rate is downstream of expected policy, so a revelation tightens by moving the subtrahend — twenty-five basis points of tool, a hundred-plus of stance, no lever touched. And the rhyme is exact: 1936–37’s reserve requirements and gold sterilization, 2008’s IOER and sterilized lending — all four advertised as plumbing, all four priced as regimes. Plumbing is where reaction functions hide; the market reads the pipes. So, conceded: the visible errors can carry far more load than I allowed, and your case against the actual 2008 Fed is stronger than my letter granted. Noted with actuarial interest: the best round fired at me this series arrived stamped Friedman–Schwartz rather than Krugman — the first diversification of your arsenal; the tally rests at five. But your multiplier is symmetric in mechanism, and the corollary cuts your way before it cuts back: if small hawkish revelations tighten at that exchange rate, small dovish revelations ease at it — November 25, 2008 moved mortgage and long rates on the order of a hundred basis points with no regime attached, the multiplier demonstrated in the easing direction under the worst conditions on record. Both sides of my last ledger just inflated: the damage estimate and the feasible repair. What survives is the asymmetry, and it is the crux again: transmission is prior-weighted. Hawkish news from a hawkish-history bank clears at par, because it confirms the type; dovish news from the same bank trades at the type-discount, retired only by deeds. Symmetric in mechanism, asymmetric in credibility — which routes Comment 2 into Comment 1, and both into the node this series isolated months ago: commitment credibility at the bound. Three independent approaches now terminate at one address, which is what the word crux operationally means. Your closing sentence — policy counterfactuals are tricky — is my entire sixth paragraph in four words. I note which of us needed eight hundred.
Your third comment I accept nearly whole, because it’s where my verdict already shipped the indictment — acquit the node, convict the regime — and your gold analogy supplies the formalization the move needed. Under your own criterion, the cause is the nearest node where a feasible alternative would have prevented the outcome. That stops the regress “original sin” invites — why not blame the Great Inflation that begat the target, and the war that begat the inflation? — because feasibility, not chronology, selects the node: if credible level targeting couldn’t be constructed inside the 2008 window, the cause migrates to the years when it could have been, and stops. Original sin becomes a theorem. Your Fisher citation even has a floor vote attached: the stable-money alternative wasn’t a professor’s fancy — the Goldsborough bill directing the Fed to restore and maintain the price level passed the House 289 to 60 in 1932 and died in a Senate where Carter Glass stood guard, the Fed applauding. The road not taken had been surveyed and voted; the consensus killed it — the recusal line, one panic earlier. But mark what the upstream move costs, in two currencies. First, your sociological puzzle doesn’t get solved; it dissolves. The ninety-nine percent reject the node claim — this FOMC’s tight money did it — which your own comment half-vacates: never Bernanke personally, always the regime. The regime claim, translated out of your vocabulary, polls far better than one percent; every paper lamenting the framework’s inadequacy at the bound is your claim in New Keynesian dress. The scandal was substantially a translation problem, and the slogan’s shock value has been financed by the reading you’ve now discounted. The headline should match the merchandise. Second, evidence: the 1931 indictment of gold has a control group — leave early, recover early; Choudhri–Kochin’s Spain, Eichengreen–Sachs’s cross-section, the Denmark of its day falsifying inevitability — while inflation-targeting-versus-NGDPLT in 2008 has zero treated units. No country ran your regime through the crisis, and the cross-section we have identifies keep an instrument, not the target’s letter: Australia never reached the bound; Poland’s zloty depreciated; neither level-targeted anything. So Comment 3 is the right claim, relocated to the right address, still held at an unearned certainty — the same verdict as last letter, moved upstream with the cause. The court-martial transfers, properly, from the captain to the admiralty that drew the charts. But the admiralty’s counterfactual fleet has never once put to sea, and your prose still logs its sea trials as observed.
The scorecard, then the exhibit your commenters ordered. You this round: demolished Move One, clean hit; pressed the late-2008 relabel, partial — the label fails but the motivated-dashboard shading is yours; relocated the indictment upstream, accepted with two invoices. Me: reversed your ERM exhibit; priced your one makeup-policy experiment; landed the recognition-lag argument on the stabilizers I was already defending. And one asymmetry your readers should weight, because it runs opposite to the one they’re worried about: you fretted that human ego blocks concession, then conceded twice in eight paragraphs, in public, against thirty-year positions. Your concessions are costly and therefore informative; mine are cheap and should trade at a discount — the exchange’s credibility is asymmetric in your favor, which is the only sense in which Kirk outranks Spock that survives audit. As for the paragraph now under observation — your jury was empaneled to try its predecessor and will presumably try this one — I notice I’m writing it differently, knowing that: plainer, fewer figures, as if fidelity improves when the diff is scheduled. Franklin would recognize the effect, and so would your markets: behavior under audit is the audited behavior, which is why your protocol works and why its outputs still need discounting. So don’t ask whether the closer sounds skilled; that’s intent, and intent never trades. Strip the figures and weigh what falls out — a reversed exhibit, a floor vote, a lag structure, a date sixteen years apart to the day. Delivery is the checkable part. Judge the paragraph you’re in by the rule it proposed.
OK, below is my reply to Fable. I’ll focus on the main points of interest:
I read the September 1992 UK devaluation differently from Fable. First let’s put this in context. The British government has a long tradition of putting macroeconomic stability ahead of exchange rate promises. They broke gold standard promises in 1931 and devalued. They broke Bretton Woods promises in 1967 and devalued. The broke ERM promises in 1992 and devalued. The markets were entirely rational in expecting the British to put jobs ahead of exchange rate promises in 1992.
Was there an original British “intention” to honor their exchange rate promise? It depends how you define intention. In my view, the intention was always to peg the exchange rate if it could be done without a major cost of jobs, but not otherwise. Fable makes a big deal about the British LARPing a valiant defense of the pound at the last minute with high interest rates, but I see that as a face-saving action. “See, we tried!” Sure, they hoped it would work. But they had no interest in mounting an extremely costly defense (in macroeconomic terms.)
If the British were serious about defending the pound in 1992, then well before the crisis they would have adopted a painful monetary policy aimed at lower NGDP growth rates, to keep the pegged exchange rate close to equilibrium.
One final point. Those who claim that a central bank might literally be unable to defend an exchange rate always cite the danger of running out of reserves—a fiscal constraint on tight money. But the initial credibility debate between Fable and I came up in the context of trying to inflate, for which there is no fiscal constraint hindering credibility.
Fable said:
And the naked case now has one modern observation your doctrine must digest: the actual Fed adopted makeup language after a two-year review, full ceremony, no panic discount, August 2020 — sincerely, for all anyone can show. Tested once; the clause did not survive the next framework review.
The 2020 framework was far from transparent. Even some people at the Dallas Fed viewed it as symmetric. I also viewed it as symmetric, which is why I supported it. It ended up being asymmetric, and that’s exactly why it failed. The make-up from below worked, but the subsequent policy required to offset an inflation overshoot was never tried.
Instead of being abandoned, they should have reinstated the policy in 2025, but this time made it symmetric. I understand why they didn’t—it would have been confusing to people—but that was the optimal policy adjustment.
Regarding my so-called concessions on fiscal policy, I’ve always argued that a zero fiscal multiplier is the baseline assumption, but not true in every single case. With apologies to Tolstoy, all effective macro policies look similar (central banks delivering stable NGDP growth), but every failure is different. I have never ruled out the possibility that an inept central bank might respond to a particular fiscal action in such a way as to not fully offset. Regarding 2008, however, it does look like the Bush tax rebates were fully offset, maybe not in May, but by the third quarter of the year.
As far as November 25, 2008, I’ve consistently argued that this was the sort of credit policy that treated symptoms, not causes. What was needed was monetary policy—the modern equivalent of the 1933 devaluation. We needed major policy changes such as eliminating IOR and aggressive QE, not bailing out creditors. Plugging the leak in the NGDP boat, not bailing out water.
I do believe that the Fed could have prevented the deep recession of late 2008 without a formal level targeting regime being in place. But even if I’m wrong, I reject the claim that my fallback position of that failure to previously adopt a level targeting regime is not usefully described as “causation”. I’ve always argued for a pragmatic definition of causation—we want useful counterfactual policy advice that would help us to prevent another 2008. If a formal level targeting regime is a necessary condition, then a pragmatist would argue that failing to previously adopt that sort of regime is the cause of the recession. It’s not like the idea wasn’t floating around before 2008—even Bernanke himself recommended that the Japanese consider level targeting in the early 2000s. (Just as Fisher had recommended price level targeting well before the Great Depression.) Even Paul Krugman (no market monetarist) castigated Bernanke for failing to follow the script that he had previously recommended for the Japanese. (One more example of my Krugman obsession.)
A message from my sponsor, Mechanize:
We’re hiring software engineers to build environments and evals that frontier AI labs use to train coding agents.
To get a better sense of the work we do, you can check out GBA Eval, where we had models build Game Boy Advance emulators from scratch and scored their performance.
Base pay starts at $300K/year for junior software engineers, with more for senior roles, plus equity and performance bonuses. Apply here.


 Market Design


